Building a Comprehensive Monitoring Dashboard with Grafana, Loki, and Promtail


Table of contents
- Introduction
- Understanding the Components
- Prerequisites
- Step 1: Launching an EC2 Instance
- Step 2: Connecting to the EC2 Instance
- Step 3: Installing Grafana, Loki, and Promtail
- Step 4: Adding Inbound Rule and Accessing Grafana
- Step 5: Downloading Loki and Promtail Configuration Files
- Step 6: Installing Docker and Creating Containers for Loki and Promtail
- Step 7: Viewing Running Containers
- Step 7: Updating the Promtail Configuration File
- Step 8: Adding Prometheus as a Data Source in Grafana
- Step 9: Testing and Exploring Data in Grafana
- Conclusion
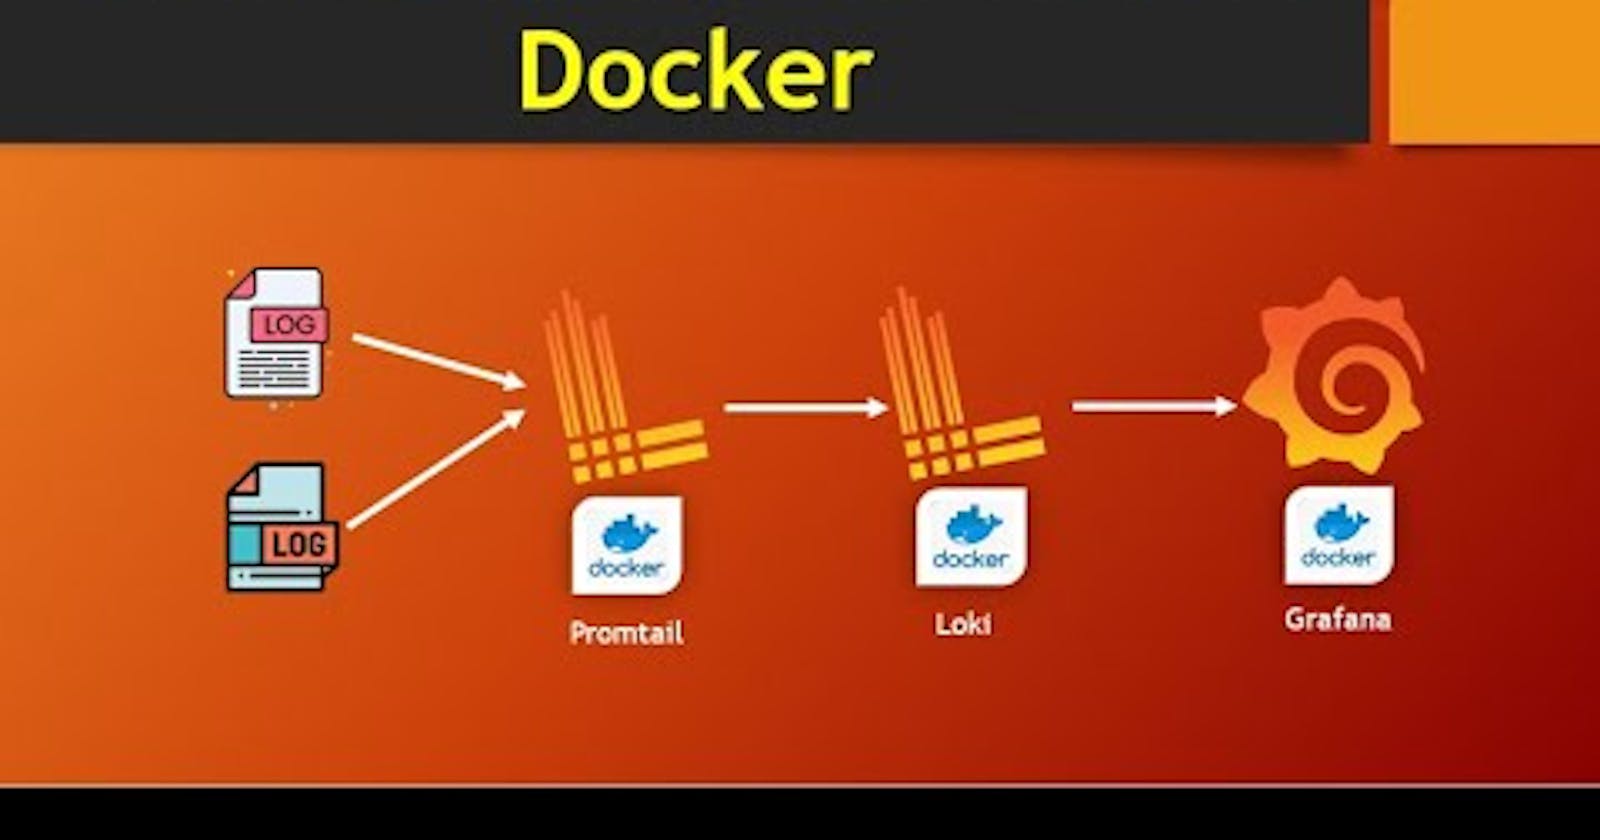
In today's fast-paced world of software development and deployment, monitoring and observability have become paramount. Understanding how our applications behave in real-time, diagnosing issues swiftly, and proactively addressing potential problems is crucial for maintaining smooth operations. In this blog post, we'll explore how to build a comprehensive monitoring dashboard using Grafana, Loki, and Promtail, leveraging Docker for easy deployment.
Introduction
Monitoring infrastructure and applications is essential for ensuring their reliability, performance, and security. Traditional monitoring solutions often struggle to keep up with the dynamic nature of modern microservices architectures. Enter Grafana, Loki, and Promtail - a powerful trio that offers a modern approach to observability, particularly well-suited for cloud-native environments.
Understanding the Components
Grafana:
- Grafana is a leading open-source platform for monitoring and observability. It provides rich visualization capabilities, allowing users to create insightful dashboards to monitor various metrics and logs effectively.
Loki:
- Loki is a horizontally scalable, highly available log aggregation system built by Grafana Labs. It is designed to handle large volumes of log data generated by distributed systems efficiently.
Promtail:
- Promtail is an agent responsible for collecting logs and forwarding them to Loki. It tailors logs for specific labels, making them easier to query and analyze.
Prerequisites
AWS Account: You'll need an AWS account to create an EC2 instance.
EC2 Instance: Spin up an EC2 instance with your desired specifications. Ensure it has internet access and meets the minimum requirements for running Grafana, Loki, and Promtail.
Step 1: Launching an EC2 Instance
Log in to your AWS Management Console.
Navigate to the EC2 dashboard and launch a new instance.
Choose the desired Amazon Machine Image (AMI) based on your preference (e.g., Ubuntu, Debian).
Configure the instance details, including instance type, VPC, subnet, security group, and key pair.
Review and launch the instance.
Step 2: Connecting to the EC2 Instance
Once the instance is running, connect to it using SSH.
Use the provided key pair to authenticate the SSH connection.
Step 3: Installing Grafana, Loki, and Promtail
To install Grafana on Debian or Ubuntu, follow these steps:
- Install necessary packages:
sudo apt-get install -y apt-transport-https software-properties-common wget
- Download and add the Grafana repository key:
sudo wget -q -O /usr/share/keyrings/grafana.key https://apt.grafana.com/gpg.key
- Add the Grafana repository: For stable release:
echo "deb [signed-by=/usr/share/keyrings/grafana.key] https://apt.grafana.com stable main" | sudo tee -a /etc/apt/sources.list.d/grafana.list
For beta release:
echo "deb [signed-by=/usr/share/keyrings/grafana.key] https://apt.grafana.com beta main" | sudo tee -a /etc/apt/sources.list.d/grafana.list
- Update the list of available packages:
sudo apt-get update
- Install the latest OSS release of Grafana:
sudo apt-get install grafana
- To start Grafana Server:
sudo /bin/systemctl status grafana-server
Following these steps will ensure that Grafana is installed and configured correctly on your Debian or Ubuntu system.
Step 4: Adding Inbound Rule and Accessing Grafana
Adding Inbound Rule to Your EC2 Instance:
Navigate to your AWS Management Console.
Go to the EC2 dashboard and locate your running instance.
Select the security group associated with your instance.
Click on "Edit inbound rules" and add a new rule allowing inbound traffic on port 3000 (default Grafana port) from your desired IP range or from anywhere (0.0.0.0/0 for all IP addresses).
Save the changes.
Accessing Grafana:
Open a web browser and enter the public IP address or DNS name of your EC2 instance followed by port 3000 (e.g., http://your_ec2_public_ip:3000).
You should see the Grafana login page.
Logging in for the First Time:
Use the default username and password to log in:
Username: admin
Password: admin
You will be prompted to change the password immediately after logging in for the first time.
Changing the Password:
After logging in with the default credentials, Grafana will prompt you to change the password.
Enter the current password (admin) and choose a new password.
Confirm the new password and save the changes.
Following these steps will allow you to add an inbound rule to your EC2 instance to allow traffic on port 3000 for Grafana and access Grafana's web interface using the default credentials, after which you can change the password for security purposes.
Step 5: Downloading Loki and Promtail Configuration Files
To download the Loki and Promtail configuration files, follow these commands:
- Download Loki configuration file (loki-config.yaml):
wget https://raw.githubusercontent.com/grafana/loki/v2.8.0/cmd/loki/loki-local-config.yaml -O loki-config.yaml
- Download Promtail configuration file (promtail-config.yaml):
wget https://raw.githubusercontent.com/grafana/loki/v2.8.0/clients/cmd/promtail/promtail-docker-config.yaml -O promtail-config.yaml
These commands will fetch the respective configuration files from the Grafana GitHub repository and save them locally as "loki-config.yaml" and "promtail-config.yaml", respectively. These configuration files will be used to configure Loki and Promtail on your system.
Step 6: Installing Docker and Creating Containers for Loki and Promtail
Installing Docker:
- Docker is a containerization platform that allows you to package, distribute, and run applications in isolated environments called containers. To install Docker on your system, you can use the following commands:
    sudo apt-get update
    sudo apt-get install -y docker.io
- Creating Containers for Loki and Promtail:
Run Loki Docker Container:
docker run -d --name loki -v $(pwd):/mnt/config -p 3100:3100 grafana/loki:2.8.0 --config.file=/mnt/config/loki-config.yamlThis command creates a Docker container named "loki" using the Grafana Loki image (version 2.8.0).
-d: Runs the container in detached mode (in the background).--name loki: Specifies the name of the container as "loki".-v $(pwd):/mnt/config: Mounts the current directory to the "/mnt/config" directory inside the container. This is where the Loki configuration file (loki-config.yaml) will be stored.-p 3100:3100: Maps port 3100 on the host to port 3100 on the container, allowing access to Loki's API.grafana/loki:2.8.0: Specifies the Docker image to use for the container (Grafana Loki version 2.8.0).--config.file=/mnt/config/loki-config.yaml: Specifies the location of the Loki configuration file inside the container.Run Promtail Docker Container:
docker run -d --name promtail -v $(pwd):/mnt/config -v /var/log:/var/log --link loki grafana/promtail:2.8.0 --config.file=/mnt/config/promtail-config.yaml
This command creates a Docker container named "promtail" using the Grafana Promtail image (version 2.8.0).
-d: Runs the container in detached mode (in the background).--name promtail: Specifies the name of the container as "promtail".-v $(pwd):/mnt/config: Mounts the current directory to the "/mnt/config" directory inside the container. This is where the Promtail configuration file (promtail-config.yaml) will be stored.-v /var/log:/var/log: Mounts the host's "/var/log" directory to the container's "/var/log" directory, allowing Promtail to collect logs from this location.--link loki: Links the "loki" container to the "promtail" container, enabling communication between them.grafana/promtail:2.8.0: Specifies the Docker image to use for the container (Grafana Promtail version 2.8.0).--config.file=/mnt/config/promtail-config.yaml: Specifies the location of the Promtail configuration file inside the container.
These commands set up Docker containers for Loki and Promtail, each configured with their respective configuration files. Loki will be responsible for log aggregation, while Promtail will collect logs and forward them to Loki for storage and analysis.
Step 7: Viewing Running Containers
After creating the containers for Loki and Promtail, you can use the docker ps command to view the list of running containers. This command provides information such as the container ID, names, status, ports, and more.
To view the running containers, simply run:
docker ps
This command will display a list of all running Docker containers on your system, including the ones you just created for Loki and Promtail. You should see entries for "loki" and "promtail" containers if they were successfully created and are currently running. If there are any issues with the containers, you can use the output of docker ps to troubleshoot and diagnose the problem.
Step 7: Updating the Promtail Configuration File
To update the Promtail configuration file (promtail-config.yaml) and add the specified targets and labels, follow these steps:
Open the promtail-config.yaml file for editing using a text editor of your choice.
Find the section where targets and labels are defined. This section typically appears under the
scrape_configskey.Add the following configuration for the desired target and labels:
    scrape_configs:
      - job_name: grafanalogs
        static_configs:
          - targets:
              - localhost
        labels:
          job: grafanalogs
          __path__: /var/log/grafana/*log
- Save the changes to the promtail-config.yaml file.
Explanation:
targets:
- The
targetsparameter specifies the address(es) that Promtail should scrape logs from. In this case, it is set to "localhost," indicating that Promtail should collect logs from the local machine.
- The
labels:
- The
labelsparameter allows you to attach additional metadata to the collected logs. Here, we specify a custom label named "job" with the value "grafanalogs," which helps identify the logs related to Grafana. Additionally, the__path__label specifies the path pattern for the log files to be scraped. In this example, it's set to "/var/log/grafana/*log," indicating that Promtail should collect logs from files matching this pattern in the "/var/log/grafana/" directory.
- The
This configuration is necessary to instruct Promtail on where to find and scrape the logs from, as well as to provide metadata (labels) for better organization and querying of the logs within Loki. It ensures that Grafana logs are collected and forwarded to Loki for storage and analysis, allowing you to gain insights into Grafana's behavior and diagnose any issues that may arise.
Step 8: Adding Prometheus as a Data Source in Grafana
Open a web browser and navigate to your Grafana web interface by entering your EC2 instance's public IP address followed by port 3000 (e.g., http://your_ec2_public_ip:3000).
Log in to Grafana using your credentials (if you haven't changed the default credentials, it's usually admin/admin).
Once logged in, you'll be taken to the Grafana home dashboard. From the sidebar on the left, click on "Configuration" and then select "Data Sources."
On the Data Sources page, click on the "Add data source" button.
Choose "Prometheus" as the data source type from the list of available options.
In the "HTTP" section, enter the URL of your Promtail instance. Since Promtail is running on your EC2 instance on port 3100, the URL will be like http://your_ec2_public_ip:3100.
Optionally, you can specify a custom name for this data source under the "Name" field.
Scroll down and click on the "Save & Test" button to save the data source configuration and test the connection to Promtail.
If the connection is successful, you'll see a green notification indicating that the data source was added successfully.
You can now use this data source to create dashboards and visualize the logs collected by Promtail from your EC2 instance.
Adding Promtail as a data source in Grafana allows you to query and visualize the logs stored in Loki, enabling you to create powerful monitoring dashboards for your applications and infrastructure.
Step 9: Testing and Exploring Data in Grafana
Navigate to the Explore section in Grafana by clicking on the "Explore" option in the sidebar.
In the query editor, select the Prometheus data source that you added in the previous step.
Under "Label filters" in the Explore section, click on "Add filter."
Select "Label" and choose "job" from the dropdown menu.
Select "Value" and choose "grafanalogs" from the dropdown menu.
Click on "Run query" to execute the query and retrieve logs filtered by the selected label values.
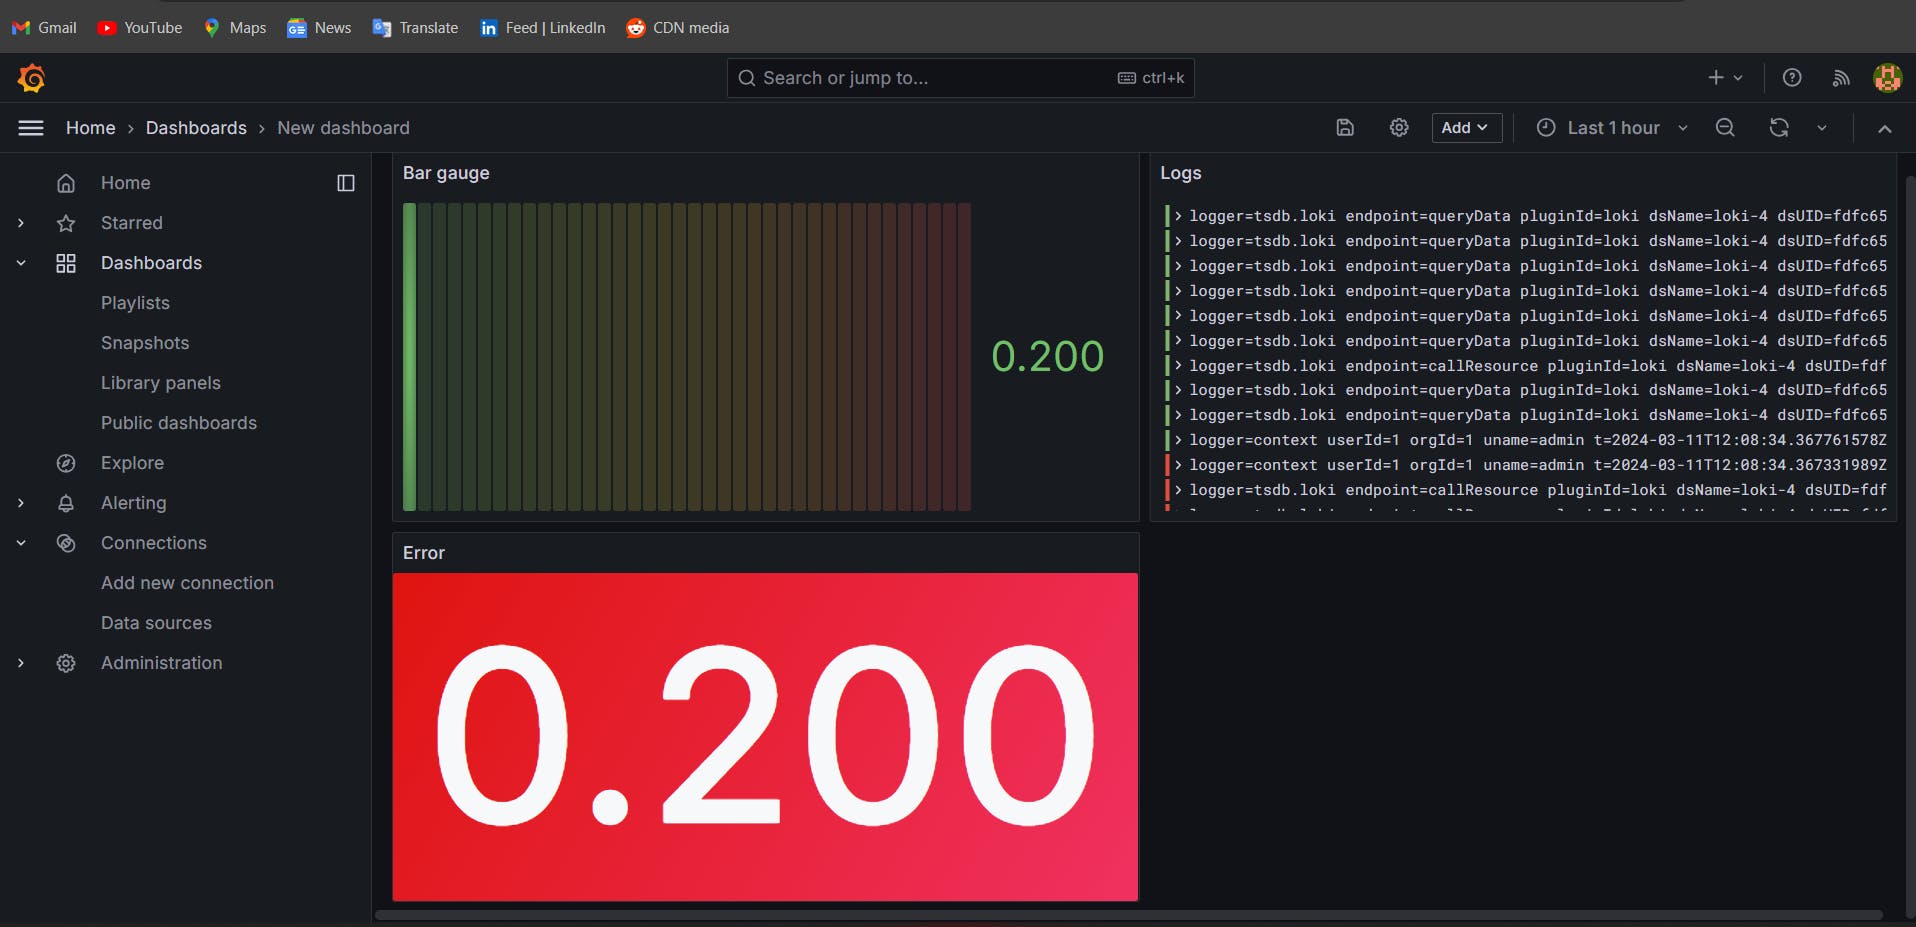
Once you see logs appearing in the results, you can explore different visualizations by clicking on the "Visualization" dropdown menu and selecting the desired graph type (e.g., Graph, Table, Heatmap, etc.).
Customize the visualization settings as needed, including time range, axes, grouping, and other options.
Once you're satisfied with the visualization, click on the "Add to dashboard" button above the query editor.
In the "Add panel to" section, select "New dashboard" to create a new dashboard, or choose an existing dashboard if you prefer.
Customize the panel settings as needed, including the panel title, visualization type, and other options.
Click on the "Add" button to add the panel to the dashboard.
Once added, you can further customize the dashboard layout, add additional panels, and configure dashboard settings to meet your monitoring requirements.
Finally, save your dashboard by clicking on the "Save" button in the top menu and providing a name for your dashboard.
By following these steps and using the label filters in the Explore section, you can effectively filter logs based on specific criteria and create custom dashboards with the desired visualizations to monitor your applications and infrastructure in Grafana.
Conclusion
In this guide, we have covered the setup and utilization of Grafana, Loki, and Promtail to establish a comprehensive monitoring and visualization solution. By integrating these tools, users can achieve enhanced observability and gain valuable insights into their applications and infrastructure.
Grafana serves as the central dashboarding platform, offering rich visualization capabilities to create insightful dashboards. With Grafana, users can monitor various metrics, analyze logs, and set up alerts to ensure system reliability and performance.
Loki, a highly scalable log aggregation system, complements Grafana by efficiently storing and querying log data. By leveraging Loki, users can easily collect, index, and search logs from various sources, enabling effective troubleshooting and root cause analysis.
Promtail, an agent for log collection, seamlessly integrates with Loki to scrape and forward logs to the central storage. With Promtail, users can tailor log collection based on specific labels, facilitating efficient log management and analysis.
Combined, Grafana, Loki, and Promtail offer a robust monitoring and observability stack that empowers users to monitor, troubleshoot, and optimize their systems effectively. Whether it's visualizing metrics, analyzing logs, or setting up alerts, this integrated solution provides the tools necessary to ensure the reliability, performance, and security of applications and infrastructure.
Uses in Combined:
Comprehensive Monitoring: Grafana, Loki, and Promtail together provide a comprehensive monitoring solution, covering both metrics and logs. Users can visualize system performance metrics and analyze logs in a single interface, enabling holistic monitoring of applications and infrastructure.
Troubleshooting and Diagnostics: With Loki's efficient log aggregation and querying capabilities, coupled with Promtail's flexible log collection, users can quickly troubleshoot issues and diagnose problems in their systems. Grafana's visualization features further aid in identifying patterns and trends within logs and metrics.
Alerting and Notification: Grafana's alerting engine allows users to set up alerts based on predefined thresholds or conditions. By integrating with Loki and Promtail, users can create alerts based on log events, enabling proactive monitoring and timely response to potential issues.
Capacity Planning and Optimization: By monitoring metrics and analyzing logs over time, users can identify resource usage patterns, forecast capacity requirements, and optimize system performance. Grafana's historical data visualization capabilities facilitate long-term analysis and trend identification.
Security and Compliance: Centralized log management provided by Loki ensures that all log data is stored securely and can be accessed and analyzed as needed for security audits, compliance requirements, and forensic investigations.
By leveraging Grafana, Loki, and Promtail in combination, users can achieve a comprehensive monitoring and observability solution that meets the evolving needs of modern applications and infrastructure, ensuring reliability, performance, and security.